Rachel Moffat
Student ID: 14325201
Supervised by Simon Gächter
Student ID: 14325201
Supervised by Simon Gächter
School of Economics
ECON3001 Dissertation 2020/2021
University of Nottingham
ECON3001 Dissertation 2020/2021
University of Nottingham
This dissertation is presented in part fulfilment of the requirement for the completion of an undergraduate degree in the School of Economics, University of Nottingham. The work is the sole responsibility of the candidate.
The experiment conducted has received ethical approval and is in compliance with the Nottingham
School of Economics Ethics Committee.
I am happy for my dissertation to be made available to students in future years if chosen as an
example of good practice.
Abstract.
As society ages, it is paramount to understand how the upcoming generation of adults integrate into age diverse groups. I investigate the cooperative behaviour of individuals aged 18 to 25 years old in an online two-person public goods game which varied the provision of group age information. I find that younger individuals are more likely to conditionally cooperate when their partner is of the same age and the influences of work experience, charitable giving and social identity depend on the age makeup of the cooperating group. Overall, my results motivate further research into understanding the intricate connections between social preferences and demographical realities in age heterogeneous interactions.
Table of Contents
1. Introduction
2. Related Literature
3. Experimental Design
4. Results
4.1. Heterogenous Preference Across Treatments
4.2. Contribution Behaviour and Beliefs
4.3. Relationship Between Contributions and Beliefs
4.4. Deviations from Predicted Choice
4.5. Factors Determining Conditional Cooperation
5. Discussion
6. Conclusion
References
Appendix
1. Introduction
Most models of human behaviour in economics assume that all people are solely motivated by self-interest (Fehr and Schmidt, 2006). However, extensive research using experimental games attests that a substantial number of people regularly exhibit unselfish or other-regarding behaviour. A large share of rebuttable evidence comes from public goods games (see Chaudhuri, 2011 for a summary). By definition, public goods are non-excludable and non-rivalrous, creating the classic free rider problem. Under the self-interest hypothesis, the dominant solution is for individuals to not contribute to the provision of the public good and free ride on the good’s collective benefits derived by the contributions of others. The conflict between the selfish incentives and the social optimum of collective welfare leads to an inefficient undersupply of the good (Samuelson, 1954). Society presents multiple situations in which cooperative behaviour, as desired for public goods, is vital – teamwork in employment, provision of environmental protective measures and volunteering, to name a few. In such cases, it is often hard to determine if individuals act in accordance with economic theory or present other-regarding behaviour due to the diversity present in the population.
I focus my attention on age diversity. 1 in 4 people in the UK are projected to be aged 65 or over by 2050 (ONS, 2021). An ageing population raises concerns about whether interactions across different age groups can achieve socially efficient outcomes. Several studies in the economic and psychological literature indicate that younger individuals give less regard to collective welfare than older individuals (see e.g., Section 2; Bekkers and Wiepking, 2007). It is therefore increasingly important to understand the mechanics and driving forces of cooperation by younger people as the population ages.
In this paper, I use a public goods game with two group members; a young adult aged 18 to 25 and a hypothetical individual (see Section 3); to address the question of whether knowing the age bracket of the hypothetical individual is linked with the young adults’ cooperative preferences, contribution and belief behaviour, and preference consistency. In the experiment, I vary the age information provided about the hypothetical individual to assess the extent of selfish behaviour towards three specific groups: individuals aged 65 or older, aged 18 to 25, and ambiguously aged individuals. Additionally, I investigate whether specific demographic factors influence cooperative preferences and if their influence is altered by the young persons’ knowledge of their group’s age makeup.
Summarising the key results shown in Section 4, I firstly find that a group’s age composition matters for cooperation. Young adults are more likely to cooperate conditionally when working with an individual aged 18 to 25 years old, and the conditional cooperators’ contribution decisions are heavily influenced by their beliefs of the other (young) group member. Secondly, the two most common elicited preference types, free riders and conditional cooperators, act more consistently with their type’s predicted behaviour when age information is provided. Finally, in Section 4.5, I present the positive effect of charitable behaviour and the surprisingly negative effect of work experience on the probability of being classified as a conditional cooperator when the young adult is grouped with an individual aged 65 or over. I also note the influence of social identity on cooperation. I discuss these findings in Section 5 before concluding in Section 6.
2. Related Literature
There is a vast amount of literature on public goods games. Chaudhuri (2011) provides a concise survey of experiments using linear public goods games, building upon the work of Ledyard (1995) by adding new insights gained from the significant number of studies conducted since the early 1990s. A pivotal development in the literature is the greater understanding and explicit labeling of preference types of cooperative behaviour. Ledyard’s (1995) survey found that in repeated public goods games, subjects contributed between 40% and 60% of their endowment, but contributions declined over time as more players chose the optimal free riding strategy. He speculated that there were types of players in these games, however more data was needed to provide evidence for such distinctions.
The classification of preference types rested on the experimental design tested in the seminal paper by Fischbacher et al. (2001) [henceforth FGF]. Using the strategy method (Selten, 1967), FGF elicited a subject’s cooperation preference by revealing their contribution decisions across all possible outcomes in the domain of a public goods game. A contribution table presented participants with 21 possible average contribution levels of the other group members. FGF then classified participants according to their contribution schedule in response to the table. They found that 50% of their subject pool were conditional cooperators and that the interaction of heterogeneous preference types, conditional cooperators, free riders and “hump-shaped” cooperators, provided evidence of the decay in contribution found in other public goods game experiments (see Section 3 for classification definitions).
Fischbacher, Gächter and Quercia (2012) [henceforth FGQ] added to the discussion of heterogeneous preference types by combing the strategy method with the more commonly used direct response method; subjects make decisions whenever and wherever the course of play in the game guides them to. ¹FGQ conducted two experiments: the P- and the C-experiment.
The P-experiment used the strategy method, akin to FGF’s approach, to classify subjects into preference types. The experiment asked how many of their 20 endowed tokens the participant would contribute to a public good (‘project’), if firstly, they unconditionally contributed with no knowledge of other subject’s contribution levels, and if secondly, they contributed conditionally on a set of 21 possibilities of average contributions by other subjects. Participants were randomly matched into groups consisting of four subjects and the public good had a marginal per capita return (MPCR) of 0.4; the dominant strategy was to free ride. The two-step design incentivised subjects to carefully consider each decision as either one could determine the subject’s monetary payoff. However, only the conditional contribution response (the second part) was used to classify subjects into types. The C-experiment used the direct response method where, using the same game parameters as the P-experiment, subjects played ten rounds of the public goods game. The groups were also randomly reshuffled after each round to remove reputation effects. ²Subjects were asked in each round how much they wished to contribute to the public good and, additionally, their beliefs of the average contribution of the other three group members.
FGQ found heterogenous preferences; 55% of subjects were classified as conditional cooperators, 23% as free riders, 12% as triangle contributors (“hump-shaped”) and 10% as others. Moreover, the experimental design allowed FGQ to assessthe consistency of preference types and whether deviations in consistency were attributable to a specific preference type. Results showed that specific classified types behaved consistently across the two experiments, with free riders having lower contributions and beliefs than conditional cooperators. Indeed, free riders were the most consistent with 60-80% of their choices in the C-experiment being in line with predicted choices revealed in the P-experiment. In a complementary study using the same experimental design but highlighting the effect of beliefs, Fischbacher and Gächter (2010) found that contribution decisions are shown to depend on a person’s beliefs about others’ contribution. ³
¹FGQ primarily studied the differences between the strategy and direct response method in eliciting social preferences but found no disparities. Brandts and Charness (2011) summarised the lack of differences found between the two methodologies in the literature.
² Andreoni and Croson (2008) summarised results found in studies which use “partners” versus “strangers” treatments to identify the effects of reputation on contribution decisions.
³See also Croson (2007) who reports that almost 92% of subjects in a public goods game presented a positive correlation between their beliefs of others’ contribution and their own contributions.
Participants in FGQ’s (and Fischbacher and Gächter, 2010) study were considered a homogenous group. Their experiment does not provide insight into the distribution of demographically different subjects across the preference types identified. Previous literature has, however, sought to research factors that influence the cooperative behaviour of individuals. In several cases, existing research has looked at the impact of age heterogeneity in groups on cooperation in public goods games. 5
List (2004) studied social preferences using three field experiments. In his first experiment, volunteers were recruited at a sportcard show. Subjects, consisting of a variety of ages, income, and education, were either endowed with 10 sportcards (one-shot treatment) or 100 tokens (multiple shot treatment) to use in a standard public goods game. Contribution of their endowed goods highlighted a subject’s desire to cooperate within the four-person group they were randomly assigned into. To analyse the effect of age, participants were classified among three age groups; young (aged 18 and under); middle-aged (aged 19 to 49); and mature (age 50 or over). A positive link was found between the age of the subject and their rates of cooperation; participants in the mature cohort contributed more to the public good under both treatments. Even after controlling for other factors that impact contribution decisions such as gender and education in the one-shot treatment, the free riding strategy is played twice as often by those aged 49 and below. The age effect on contributions is corroborated in the multiple shot treatment. List suggested that the results reflect the more altruistic nature of the mature cohort, with the age effect presenting a U-shape which increases at the age of 30. The link between age and social preferences is shown in the two other experiments conducted, one a university fundraiser and the other a game show. An additional comparison between gender showed that young males are more selfish than young females, but the probability of giving increases much more over time for males than females.
List (2004) notes that his findings provided evidence of an age effect, although purely generational effects could not be ruled out. Moreover, subjects were not provided information about the age makeup of the other group members they were working with. Charness and Villeval (2009) addressed these two issues by looking at intergenerational cooperation in a series of decision tasks. They employed a standard linear public goods game in their Team Production Task where participants, in groups of three, played eight periods of the game with
4 See also Gutiérrez-Roig et al. (2014) who studied cooperation across subjects aged 10 to 87 in a Prisoners Dilemma game. Older individuals (age>70) cooperated significantly more as compared to younger age groups. However, individuals aged 17 to 65 did not present different cooperative patterns, but their behaviour as compared to younger people (age<16) was more persistent and less reliant on observed behaviour.
information about the generation composition of the group and eight periods without. An additional two-stage game was played in the seventeenth period where the subject could select the generational composition of their group before playing another round of the game. The research combined an experiment in the field using senior and junior workers, and in a laboratory using undergraduate students and retirees. Results showed that seniors (aged > 50), contributed more than the juniors (aged < 30) in both the field and lab, and information provision concerning the age of the group members increased average contributions for all subjects. However, knowledge of group generation heterogeneity led to more contributions in the field whereas such groups were less cooperative in the lab. They attributed this difference to the experience of working in a mixed environment; working juniors cooperated with their working seniors for efficiency whilst students integrated with seniors to take advantage of their higher contributions. Focusing on the younger age groups, they found that working juniors contribute significantly more than students, potentially reflecting the impact of work experience on cooperation.
Further research within behavioural economics has been conducted to investigate demographical factors, separate but affiliated with age, that may influence cooperation. 5 As aforementioned, List (2004) found that gender had an impact on cooperative preferences, however, there is no consensus in the literature. Balliet et al. (2011) conducted a meta-analysis of social dilemma games and found no systematic difference in cooperation between men and women.
Social identity, the perceived sense of belonging to a social group, is also highlighted to be a conditional factor on cooperation. 7 McLeish and Oxoby (2010) used the strategy method in an ultimatum game8 to investigate perceived membership to a group. Student subjects who were exposed to a salient identity primer (writing about positive experiences with fellow students) were significantly more cooperative than those who identified differences (writing about positive experiences with people who are not students) or those who do not identify at all with their group. These findings echoed those of Chen and Li (2009) who found that players were more likely to make decisions to attain the social optimal outcome in a two-person
Bekkers and Wiepking (2007) summarised studies into factors, including gender, race, and religion, that influence generosity and philanthropy.
Social dilemma games covered public goods games and Prisoners Dilemma. See Dawes (1980) for discussion
on social dilemmas
Akerlof and Kranton (2000) proposed a model of utility including identity. Identity changes the payoffs from an
individual’s own actions and the payoff of others’ actions.
Ultimatum games are played between two players: X and Y. Player X offers some of the money they are allotted to Y. If Y accepts the offer, they gets the offered sum and X keep the rests. However, if the player Y rejects the offer, both X and Y get nothing
sequential move game (Charness and Rabin, 2002) when they are from the same assigned group, as opposed to being matched with a member not from their group. Although participants in their experiment exhibited envy when they received a lower payoff than their partner, it was significantly less potent when the pair were an ingroup match.
I aim to contribute to this literature by integrating FGQ’s methodological approach in assessing the contribution and belief behaviour of classified preference types and the ongoing research into the significance of group age composition and factors driving cooperation of young adults. To the best of my knowledge, this has not been done before.
3. Experimental Design
The experiment implements the basic decision situation of a linear public goods game. Subjects are informed that they are in a group consisting of two people and each group member is endowed with 10 tokens. The subject can decide whether to keep the tokens or contribute to an arbitrary group project; a public good. The token payoff for each subject is given as:
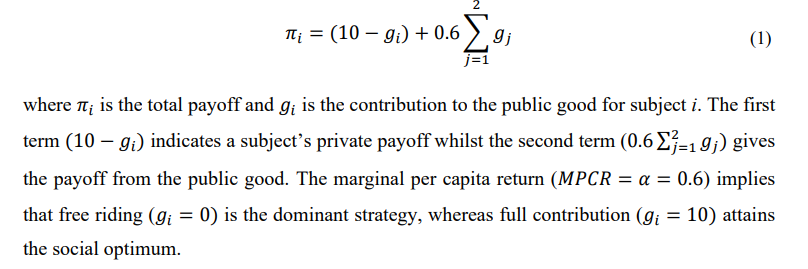
A set of control questions were asked, after detailing the decision situation, to ensure that subjects understood the dilemma of the game and its dominant selfish incentive (see Appendix A). Subjects only progressed to the experiment once all eight control questions were answered correctly.
Standard public goods games require two or more players. Constraints with the distribution of the experiment online mandated that the minimum two-person group consisted of the subject and a randomly assigned hypothetical individual. The hypothetical person did not partake in the experiment, however subjects were told to ‘think of them as another person who you are in a group with’. Consequently, a participant’s token payoff was also hypothetical. Subjects were instructed that their payoff, although equitable to monetary units, would not be paid out at the end of the experiment. These facts were stressed throughout the survey to ensure that individuals were not deceived. Despite the potential limitations of the hypothetical nature of the experiment (see Section 6), Kahneman and Tversky (1979) note:
By default, the method of hypothetical choices emerges as the simplest
procedure by which a large number of theoretical questions can be investigated.
The use of the method relies on the assumption that people often know how they
would behave in actual situations of choice, and on the further assumption that
the subjects have no special reason to disguise their true preferences. (1979,
p.265)
If significant effects are found within the hypothetical experiment it provides reasonable motivation for further investigation.
The experimental procedure replicates FGQ’s design (see Section 2). FGQ use a P- and C-experiment to utilise the strategy and direct response method, respectively. I conduct effectively identical P- and C-experiments following the decision situation detailed above. By reason of FGQ’s finding that sequence effects of the experiment are negligible, only a P-C order of play is presented.
In the P-experiment, replicating FGQ (and FGF), subjects indicate how many of their 10 tokens they want to contribute to the project corresponding to 11 possible values of the contribution of the other group member using a “contribution table” (see Appendix A.3.2.2). The table elicits a subject’s cooperative preference. Any positive contribution at each of the 11 nodes denotes a willingness to cooperate as free riders, who follow the dominant selfish incentives, choose to contribute zero throughout. Like FGQ, the P-experiment is played once to remove any strategic incentives, allowing preference type to be classified. Subjects also make an “unconditional contribution” that consisted of a single contribution choice to the project. In contrast to FGQ, who used this decision to construct monetary payoffs, the “unconditional contribution” is an arbitrary question to allow subjects to apply the decision situation in a contextualised manner.
After completing the P-experiment, participants were informed that another experiment (the C-experiment) would be conducted and that the survey would finish after. For simplicity, as FGQ found similar results under a one-shot and repeated C-experiment, I required subjects to play only one round of the public goods game. In the C-experiment, participants denote their own contribution and their belief about the contribution of the other hypothetical group member to the project. FGQ note the elicitation of a subject’s beliefs for two reasons: firstly, to assess the correlation between contributions and beliefs, and secondly, to make point predictions about an individual’s contribution in the C-experiment given their expressed beliefs, using the contribution schedule given in the P-experiment (see Section 4.4).
The survey targeted subjects aged 18 to 25 to focus on the cooperative behaviour of young adults entering, arguably, more age diverse collaborative group environments such as university projects, employment, charitable giving, and the like. An age control question is included in the survey to ensure that subjects were within the 18 to 25 age band. Eligible participants were randomly allocated across three treatments which all followed P-Cexperiment procedure. Participants in the “Old” treatment are informed that the hypothetical individual is aged 65 and over, in the “Young” treatment the individual is aged 18 to 25, and no information is provided in the “Control” treatment (see Appendix A.4). The Old and Young treatments included additional control questions to verify that subjects knew the age of the hypothetical individual.
Using this experimental design is critical to understanding young adult’s prevalence of cooperation by uncovering their social preferences. Comparisons across the treatments aims to assess whether there are differences in the presence of preference types and the magnitude of contributions when age information about the other hypothetical group member is provided. I can also assess whether the behavioural consistency of classified preference types and participants’ belief about the contribution of the other group member varies depending on age of the individual that the subjects are matched with.
Prior to the experiment, participants were asked a selection of anonymous demographic questions. The survey covered demographics, including income and gender, and directed questions motivated by research as to why people cooperate (see Section 2), and specifically, why people cooperate across age groups. The rationale for collecting such data was to enable the investigation into whether specific factors encourage more cooperative behaviour. For example, I ask, “Which age group do you interact most with?” to identify whether having interactions with a specific age group led to more socially orientated decisions under each age treatment.
The experimental survey was designed using Qualtrics software. To incentivise participation, respondents had the opportunity to enter a lottery to win a £15 Amazon Voucher. 128 subjects completed the survey in March 2021 following its distribution online. Hereafter, I make close comparison to FGQ’s paper due to the similarity in our sample sizes – with 140 subjects in their main repeated game experiment, 136 in the one-shot. An important caveat to note, however, is the significant dropout rate. 179 subjects started the survey but did not finish. My sample size is therefore smaller than its reach, a limiting factor of the design that I discuss later. Nevertheless, the sample attrition leads to a positive hope that the participants who completed the survey did with good comprehension of the game and in line with their true preferences.
4. Results.
In this section, I first report the heterogeneous social preferences of participants across treatments before studying the contribution and belief behaviour and consistency of preference types. Finally, I focus on the factors that drive cooperation.
4.1. Heterogenous Preferences Across Treatments
Using the P-experiment, subjects are segregated into preference types according to their contribution schedule that indicates how much they are willing to contribute for each given value of the other group member. FGF classify the subjects as the following: conditional contributors are subjects with a monotonic contribution pattern with a least one increase or a positive Spearman rank correlation coefficient between their own and the other (hypothetical) member’s contribution that is significant at the 1% level. Free riders are subjects who contribute 0 tokens for all 11 values. Triangle contributors present an increasing contribution pattern up to some maximum and a decreasing pattern thereafter, with the respective patterns being significant at the 1% level using the Spearman rank correlation. Others are subjects who do not fall into any of these defined categories.
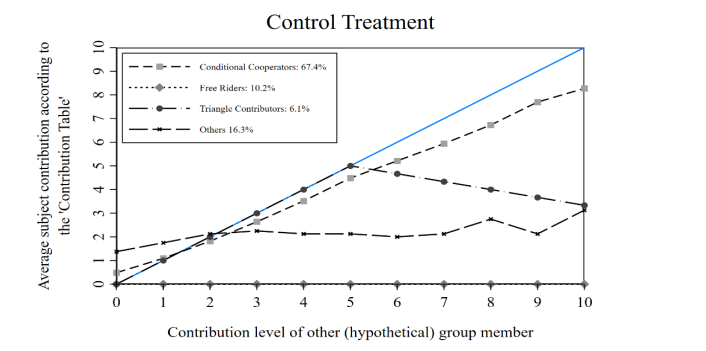
the P-experiment by preference type (45-degree = perfect conditional cooperator).
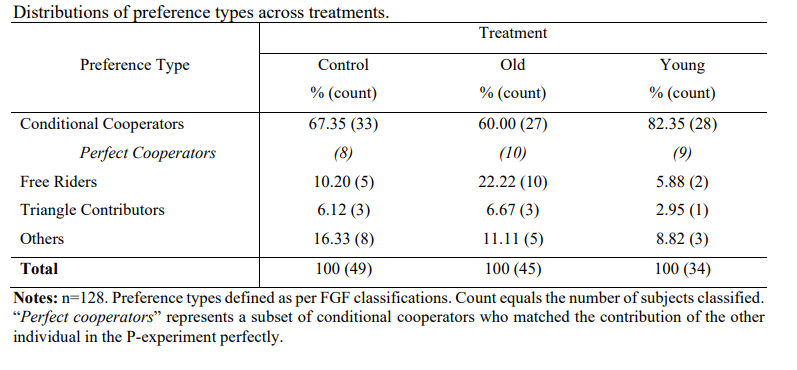
Table 1 shows the distribution of heterogenous preference types across the three
treatment groups, confirming results seen throughout the economic literature.9 The majority of
subjects are revealed to be conditional cooperators, with 82% of subjects in the Young
treatment, 60% in the Old and 67% in the Control being classified as such. Free riders represent
22% of subjects in the Old treatment but only 10% and 6% in the Control and Young groups,
respectively. Others are the third most common type of players, denoting 16% of individuals
in the Control, 11% in the Old and 9% in the Young group. All other subjects are classified as
triangle contributors. It is important to mention the unequal distribution of subjects between
groups (Control; 49, Old; 45, Young; 34) arising from the majority of subjects failing to
complete survey having been allocated into the Young treatment. Nevertheless, allocation to
treatment was still successfully random.
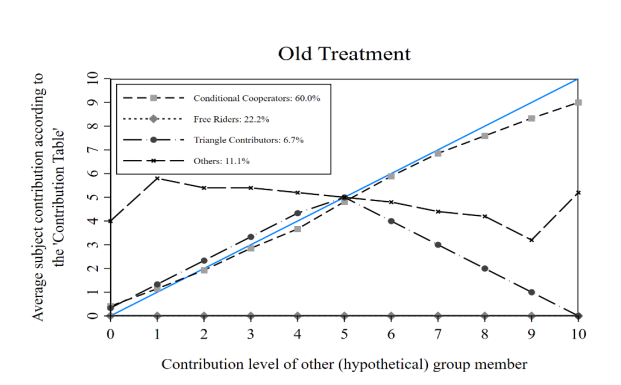
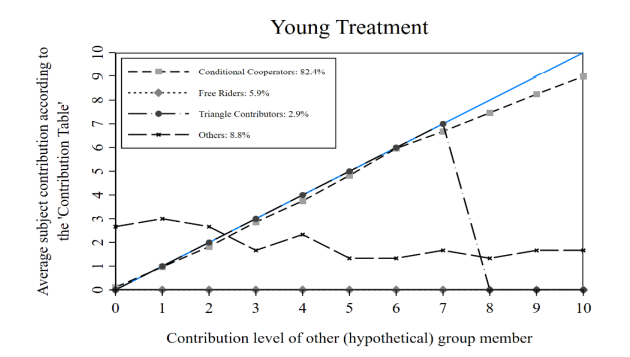
Figure 1 illustrates, for each treatment, the mean contributions for each contribution level of the hypothetical individual by preference types. I conduct a pair-wise Fisher exact test to assess the distribution of the two most common preference types across the three treatments. The null hypothesis of an equal distribution of free riders across treatments cannot be rejected (Fisher exact test, p=0.101). On the contrary, the observed prevalence of conditional cooperators is significantly different across the three age treatments (Fisher exact test, p=0.096). Accordingly, this supplies evidence that young adults have a greater propensity to cooperate with individuals of the same age.
4.2. Contribution Behaviour and Beliefs
I next look at the behaviour of each subject within their preference type classification. The C-experiment elicits both the contributions and beliefs of the subjects in a one-shot public goods game. The descriptive statistics of the behaviour of each preference type within each treatment in the C-experiment is shown in Table 2.
Comparing across all types, conditional cooperators contribute significantly more than free riders, triangle contributors and others in the Old (Kruskal-Wallis test10, p=0.001), Young (Kruskal-Wallis test, p=0.065) and Control (Kruskal-Wallis test, p=0.023) groups. These
See Section 2. Also see Fischbacher and Gächter (2006, 2010); Keser and van Winden (2000); Fehr and Fischbacher (2002,2003).
All reported Kruskal-Wallis test p-values follow a 𝜒 2 with ties distribution to account for the ties present in the binary coded data.
results replicate FGQ’s findings that free riders contribute the least to the public good.11 The Young treatment presents the largest disparity in contributions. Conditional cooperators contribute an average of 5.75, 4.52 and 4.85 tokens whilst free riders contribute 0, 0 and 1.6 tokens in the Young, Old and Control treatments, respectively.
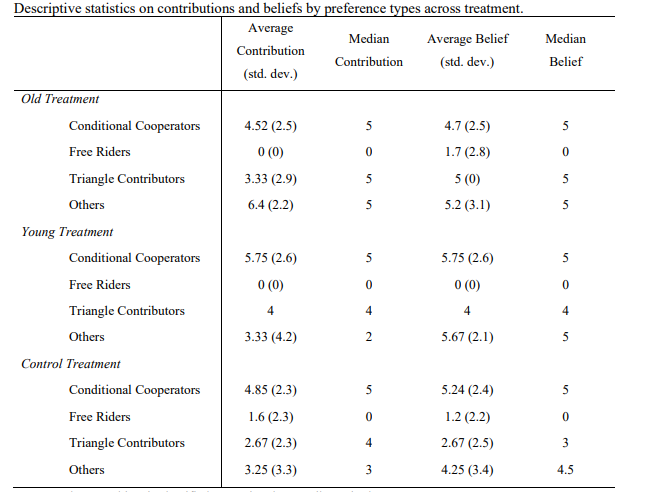
Notes: Only one subject is classified as a Triangle Contributor in the Young Treatment.
Beliefs about the contribution of the other hypothetical group member systematically differ by preference types within each group (Kruskal-Wallis test, Old; p=0.053, Young; p=0.096, Control; p=0.029). Conditional cooperators, by treatment, hold significantly higher beliefs than all other preference types. In fact, conditional cooperators are symmetric in their contributions and beliefs (5.75 tokens) in the Young treatment, as are the free riders (0 tokens). Positive beliefs are shown for free riders in the Old (Control) treatment, presenting an average belief of 1.7 (1.2) tokens.
FGQ found that free riders contributed an average 0.1 tokens in the one-short experiment and 4.88 tokens in
the first period of the multi-round experiment.
A key observation is the low contributions and beliefs of free riders in the Young and Old groups against the Control. The contributions of free riders in the Control group are significantly higher according to a Mann-Whitney test (p=0.024) compared with the treated groups. Subjects who are provided group age information, and choose to free ride, are perfectly selfish unlike those without such information. On the other hand, beliefs of free riders are not systematically different between the Control and treated groups (Mann-Whitney test, p=0.743).
Interestingly, I cannot reject the null hypothesis that average contributions or beliefs of conditional cooperators, triangle contributors and others across treatments are different according to multiple Kruskal-Wallis tests (p>0.140). Age information is not shown to influence the magnitude of donation to the public good for those who contribute. I conjecture that this may be a consequence of cooperating individuals having a predetermined degree of giving which they follow, regardless of what age group they cooperate with.
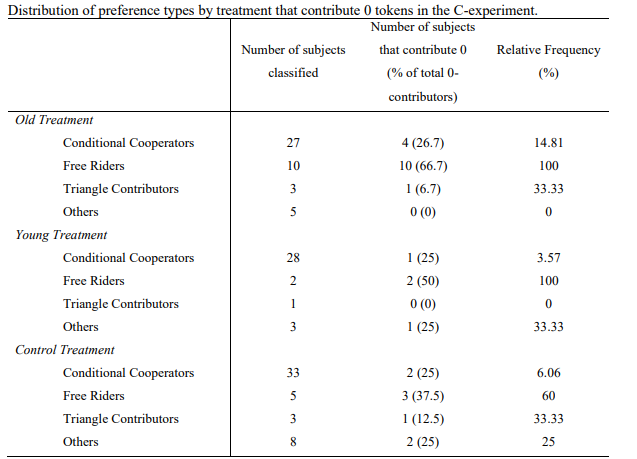
Notes: Percentages may not add up to 100 due to rounding error.
Zero contributions indicate free riding by individuals, even if subjects are not classified as such. Table 3 reports the number and relative frequency of preference types contributing 0 tokens in the C-experiment. Unsurprisingly, the majority of subjects contributing zero are classified as free riders. Across all zero-contributions, 26.7% (25%) come from conditional cooperators, 66.7% (50%) from free riders, 6.7% (0.0%) from triangle contributors, and the rest from others in the Old (Young) treatment. In the Control group, these values amount to 25%, 37.5%, 12.5% and 25%, respectively for each type.
The overall relative frequency of preference types indicates that a free rider is ten (six) times more likely to contribute 0 than a conditional cooperator in the Control (Old) group. FGQ comparatively find the difference to be between four to eight times more likely. Strikingly, a zero contribution is approximately twenty-eight times more likely to come from a free rider than a conditional cooperator in the Young treatment. This corroborates the disparities in contributions found in Table 2.
4.3. Relationship Between Contributions and Beliefs
A matter of interest is the correlation between beliefs and actual contributions. I explore this relationship by regressing actual contributions on type-interacted beliefs about the other hypothetical group member’s contribution in the C-experiment for each treatment group. Recall that Figure 1 showed the average contributions of subjects given the contribution decision of the other hypothetical individual. The slopes of the plotted lines provide a prediction that free riders (conditional cooperators) should present no (a positive) correlation between beliefs and contributions in each group.
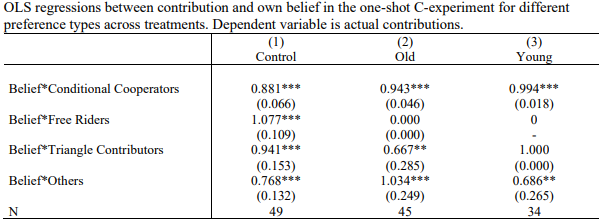
Notes: OLS, constant omitted. Robust standard errors in parentheses. Only one subject is classified as a Tringle Contributor in the Young Treatment. Belief*Free Riders in Young Treatment omitted because of collinearity – the two Free Riders both contribute and state beliefs of 0. *** p<0.01, ** p<0.05, * p<0.1
Table 4 reports the OLS regression estimates. To focus on the interaction of beliefs and specific preference types, I omit the constant and ‘belief x type’ estimates. Estimated coefficients are different across types within each group (F-tests, p>0.001). Parallel to FGQ’s Table 4 (2012, p.906), conditional cooperators, triangle contributors and others have highly significant positive slopes in the Control group. The comparatively steeper significant positive slope on free riders is unexpected. Observing the raw data indicates that this result is being driven by two free riders who provide positive beliefs and contributions, with one of those free riders contributing more than their beliefs.12
All cooperative preference types have higher slope coefficients in both the Old and Young treatment compared to free riders (F-tests, p>0.001). Free riders in both groups contribute 0 and therefore beliefs have no relation with contributions for this preference type, as predicted. Notably, the slope coefficient in the Young group is significantly higher than the Old for conditional cooperators (F-test, p=0.079). This suggests that contributions to the public good depend more on the belief of contribution from the other group member for conditionally cooperative young adults when the other individual is the same age as them.
4.4. Deviations from Predicted Choice
I next use the design of the experiment to assess how each preference type deviates from their predicted choice. Since subjects were asked to provide their contribution level for 11 contribution values of the other hypothetical individual in the P-experiment, I can calculate a point prediction of contribution for each subject in the C-experiment given their stated belief. For example, if a participant states that they will contribute 5 tokens when the hypothetical individual is shown to contribute 7 tokens, then I predict that the participant will contribute 5 tokens if they believe that the contribution of the other individual is 7 tokens. Deviation is defined as actual contribution decisions that do not equal the point prediction given for an individual. Figure 2 depicts deviations for preference types in treatments.
The percentage of choices that do not deviate across preference types and treatments closely replicates results found by FGQ. Free riders make the most consistent choices with 60% of free riders presenting perfect coincidence of predicted and actual choices in the Control group, consistent with FGQ’s 60-80%. Moreover, conditional cooperators (triangle contributors) corresponding percentage of choices is 58% (33%), again mirroring FGQ’s
12 Of the five free riders in the Control group, three state 0 for both their contributions and beliefs. One subject stated 5 tokens for each, another spent 3 tokens for their belief of 1 token from the other member.
average result of 32% (26%). Others are more consistent with 63% consistency compared to FGQ’s 10%.
In all treatments and for all preference types except for Others, the predicted choice equals the modal choice, as illustrated by the peaks in Figure 2. Remarkably, in the Old and Young treatments, free riders are 100% consistent. This result is not surprising theoretically.
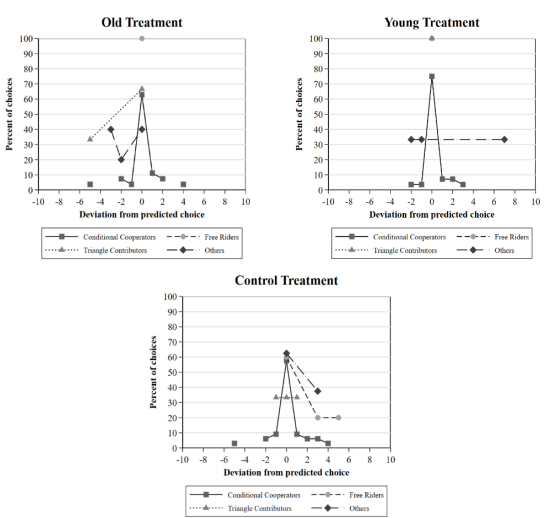
but seldom observed; it is often found that a number of free riders contribute to public goods. 13 Conditional cooperators and triangle contributors are more consistent in the Young treatment (75%; 100%) compared to the Old (63%; 67%).
13 FGQ found that free riders contribute more in their multi-shot (2.49) experiment than one-shot (0.1). See Fiscbacher and Gächter (2006) for a discussion on free riding.
As FGQ note, perfect coincidence is a demanding criterion and relaxing it to include subjects who deviate by 10% (± 1 token) of their endowment provides a clearer picture of individuals who generally act in line with their preferences. Consistency of free riders in all treatments is unchanged. However, conditional cooperators are now 76%, 78% and 86% consistent in the Control, Old and Young treatment, respectively. Likewise, triangle contributors increase to 100% consistency in the Control. Others demonstrate 63% (Control), 40% (Old) and 33% (Young) consistency rates. The median choice for all types except others, under this relaxed criterion, are therefore consistent with the types’ expressed preferences, further replicating FGQ’s results.
It is pertinent to reiterate the observed effect of the treatment. Actual choices in the Young and Old groups are more congruous with their predicted choices as compared to the Control group. Markedly, free riders follow the self-interest hypothesis perfectly in the treated groups and conditional cooperators are more consistent when their allocated group partner is aged within their own age bracket.
4.5. Factors Determining Conditional Cooperation
Hitherto, I have considered the participants to be homogenous, focusing directly on the effect of varying the level of information given to subjects on their social preferences. To determine if specific factors influence the behaviour of young adults, and whether such factors are governed by the group’s age composition, I estimate a model explicitly accounting for participant heterogeneity.
Table 5 provides variable definitions and summary statistics for the selected demographic factors. Of the 128 participants, 58% are male, 79% (75%) have a good relationship with their grandparent(s) (with authority) 14, 81% have significant work experience and 88% have family income above £30,800. 15 It should be noted that the grandparent(s) average age is 79.89 years16, with the youngest being 68 years old – above the threshold in the Old treatment. I include two dichotomous indicator variables to reveal a subject’s and their family’s charitable giving and to identify treatment group. 53% of individuals and their family donate to charity, 29% do not donate personally but their family do, 11% have no charitable giving in their family, with a 7% minority of subject donating to charity despite their family
14 Defined in Appendix A.2.11.
15 ONS, 2020. See Appendix A.2.7.
16 19 subjects had no living grandparents but were asked to indicate the relationship prior to their passing.
not. The variation present between subjects is necessary to assess whether these demographic characteristics are correlated with social preferences.
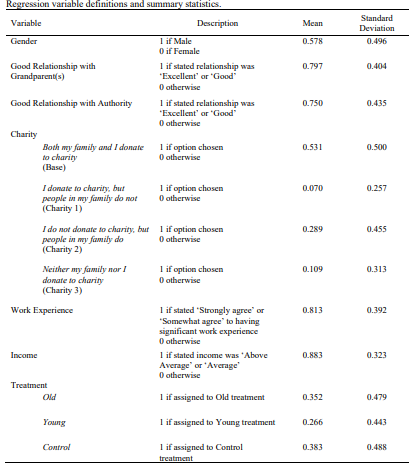
Notes: All variables are indicator variables taking binary values depending on a subject’s answer to the associated
question in the survey.
I employ the following model:
![]()
where 𝑐𝑜𝑜𝑝𝑒𝑟𝑎𝑡𝑒𝑖 equals 1 if subject i is classified as a conditional cooperator, 0 otherwise; Z is a vector of observed dummy variables, which includes subject i’s gender, relationship with their grandparents and authority, income and work experience; 𝒄𝒉𝒂𝒓𝒊𝒕𝒚 and 𝒕𝒓𝒆𝒂𝒕 are the dichotomous variables aforementioned. 𝑔(. ) represents the cumulative distribution function and standard normal distribution for the logit and probit model, respectively. Under OLS (linear probability model, LPM), 𝑔(. ) represents a linear function.
I compare across the three models for two reasons. Firstly, logit and probit models correct for the possibility of obtaining nonsensical probabilities (greater than 1, or negative) that may arise from the assumption of linearity in the LPM. Secondly, the logit and probit models, although rectifying probability estimates, have the caveat that these cannot be interpreted with ease.17 The central focus of this section is to report factors that influence the likelihood of being a conditional cooperator. I determine important factors by the significance and sign of estimated coefficients across the three models, and in cases of similarity, I use the OLS estimates as an approximation to the magnitude of the effect.
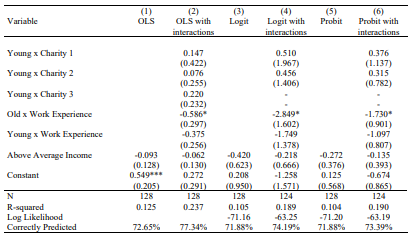
Empirical results from estimate of equation 2 are shown in Table 6. These results provide some interesting commentary on the current literature on demographic influences over social behaviour. I find no significant difference in the likelihood of being a conditional cooperator between genders and the interaction term Treat x Gender estimates negative coefficients across all models; however, this effect is not statistically different from zero in the Young and Old treatment (p>0.100).
Classification as a conditional cooperation in the Control group is shown to be significantly influenced by an individual’s level of work experience, at the 5% level. Given the similarity between models, using OLS to infer magnitude, work experience in the Control group increases the probability of being a conditional cooperator by 0.403, ceteris paribus (holds hereafter). However, the interaction of Old x Work Experience reveals that when matched with a person aged 65 or over, the probability of being a conditional cooperator decreases by 0.183 for young adults with significant work experience. There is no evidence of a systematic difference of the effect of work experience between the Young and Control group.
Charitable giving also has an interesting interpretation. All estimated coefficients for the vector variable are negative but insignificantly different from no effect. However, the influence of donative behaviour in the Old treatment is noteworthy. Estimated coefficients of
17 Logit estimates are given as log odds. Probit coefficients give the change in the z-score for a one unit change in the predictor.
Old x Charity 3 (‘Neither my family nor I donate to charity’) are significantly negative at the 5% level in all models. In column 2, the absence of philanthropic behaviour in a young adult’s life when matched with an older individual reduces the probability of being classified as a conditional cooperator by 0.542. Conversely, the same interaction with the Young dummy is insignificant, presenting no equal effect on same age groupings.
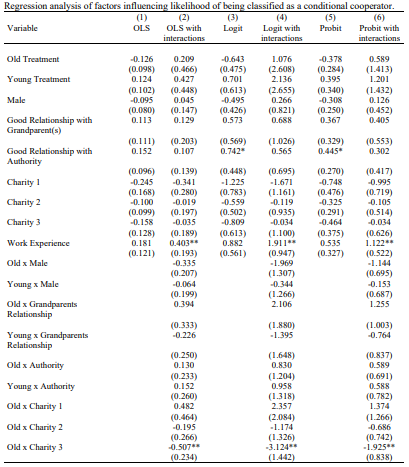
Notes: Control treatment is the base group. Robust standard errors in parentheses below estimated coefficients.
R-squared for logit and probit models is Pseudo R-Squared. Estimates of Young x Charity 3 are omitted in
column 4 and 6 due to complete separation.
*** p<0.01, ** p<0.05, * p<0.1.
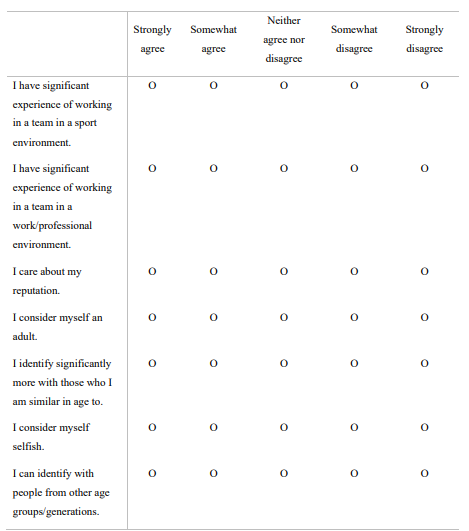
As presented, there is a lack of significant effects of the demographic factors in the Young treatment. In the survey, I posed the question of which age group do the subjects both interact and compete the most with. Responses lacked variation, leading to its omission from the regression, however, it is meaningful to note. 95% of subjects said they interact and 90% said they competed most with 18 to 25-year-olds. Therefore, it is reasonable to assume that the participants have strong social ties to others in their own age group, as compared to older individuals or partners with no known age. This is confirmed by the fact that only 8.5% of participants stated that they somewhat disagree with the statement “I identify significantly more with those who I am similar in age to” (see Appendix A.2.15).
5. Discussion
Supplying subjects with age information concerning the other individual that they are working with in a group towards the provision of a public good has a considerable impact. Precisely, conditional cooperators are clustered in the Young treatment and the contributions of conditional cooperators depend more on beliefs when the two individuals cooperating are the same age. Owing to nearly all subjects interacting and competing with the individuals in the age group defined in the Young group and the symmetry of contributions and beliefs of conditional cooperators in the C-experiment, this may be evidential of the significance of social identity on social behaviour of young adults. This has support from the psychological literature; Dawes et al. (1988) emphasizes that the feeling of ‘we’ increases cooperation in social dilemmas and Yamagishi and Kiyonari (2000) highlighted that cooperation with those in the social group is borne from the positive expectations of ingroup members. I would encourage further investigation into these issues on two fronts as social identity has economic implications, including in working environments (Akerlof and Kranton, 2005). Firstly, the experiment could be extended to include a multi-period C-experiment to explore differences in contributions and beliefs over repetition. Beliefs are shown to decay over time due to the decline in contributions (Fischbacher and Gächter, 2010); it would be interesting to explore any difference in decay due to group age-heterogeneity. Secondly, using participants across age ranges could broaden the research to whether these observed effects are local to young adults or a common factor across all ages.
Additionally, I did not find an influence of a positive grandparent relationship on cooperation in the Old treatment. While this point is speculative, this could reflect that subjects who are informed that they are working with an individual aged 65 or over do not consider this person to be someone like their older relatives. The significant negative effect of having no donative behaviour present in the individual’s family on being a conditional cooperator could corroborate this insight. If the hypothetical individual aged 65 or over was stated to be a relation to the subject, it is reasonable to suppose that the impact of a subject’s charitable behaviour would be superseded by the effect of family ties on encouraging cooperation. Support for this view comes from Molina et al. (2019) who suggested that family relations are positively correlated to cooperative behaviour, but intergenerational interactions are not.
Charness and Villeval (2009) found that working juniors cooperate with older individuals for the sake of efficiency. Although I find that work experience has a positive influence on behaving cooperatively in ambiguously aged groupings, young adults with more work experience are less likely to be conditionally cooperative when they are working with an individual aged 65 or over. I hypothesize that this may be due exploitation of younger colleagues by their older superiors, or the increasing divide seen between generations in the UK. For example, disparities were exhibited nationally after the Brexit Vote with the majority of young people voting ‘remain’ contradicting the majority of older citizens who voted ‘leave’ (Hobolt , 2016). Tajfel and Turner (1986) provide psychological insight by highlighting that intergroup conflict is more intense when individuals behave as a function of their respective group, not their individual characteristics. As such, I am speculating that young adults with work experience are influenced more by the division they perceive between themselves and their older colleagues than the exposure of working in diverse age groups.
Finally, it is important to discuss the limitations of my study. Participants were instructed to complete the experiment alone and answer all questions honestly, however, despite including control question to mitigate collusion and lying, I rely on a degree of goodwill. Furthermore, the experiment was hypothetical in nature; no monetary incentives were given to encourage participants to exert the same effort as they would do in a real-world context. In spite of these limitation, my results replicate FGQ’s results which uses both monetary incentives and a controlled laboratory environment. Read (2005) notes that real incentives do not have a core basis in experimental economics but can be used when feasible and appropriate. An ideal follow-up study could conduct the experiment with the age treatments in a laboratory where collusion can be monitored, and appropriate incentives can be given.
Despite opening the survey to all subjects aged 18 to 25, 93% of responses came from undergraduate or postgraduate students, potentially limiting the external validity of the results. Nevertheless, the majority of behavioral economic experimental studies begin with testing hypothesis on a student population to confirm presence of an effect at a basic level. Croson (2002) argues that students are the “professionals of tomorrow” (2002, p.943) and as such studying their behaviour is not a hindrance, especially in this case of my study in which students will likely soon become those required to make social decisions with various generations.
The analysis of influential factors is restricted to the extent to which the survey reveals drivers of cooperation. Indeed, there are likely unobserved factors that I have not controlled for. Within the constraints of the experiment, I believe that the questions covered enough areas of interest without substantially over-analysing the respondents as there are an immeasurable number of avenues that demographical research can take. Future investigation could perhaps focus on other influences not studied here to give a different perspective on cooperation. However, it should be noted that if such research is confined to an online experiment, that sample attrition from a high number of questions and arithmetic calculations is eminently possible.
6. Conclusion
Understanding young adults’ social preferences in the presence of age heterogeneity and the driving forces behind their cooperation is increasingly important as the population ages; these individuals will soon become key decisions makers in society. Using FGQ’s public goods game methodological approach, I present that 18 to 25-year-olds are more likely to be classified as conditional cooperators and that their belief of others has a greater impact on their contributions to the public good when they are working with their own age group, as compared to a significantly older or ambiguously aged individual. Free riders and conditional cooperators also act more congruously with their classified type’s predicted behavior when provided age information, as compared to the no information treatment which replicated the findings of FGQ. Ergo, I summarise that knowledge concerning the age makeup of the group contributing to a public good is of considerable importance when assessing the cooperation preferences and decisions of young adults.
In assessing the influence of demographic factors noted in the literature on cooperative behavior, I observe that the effect of work experience and lack of charitable giving depend on the group’s age makeup. Both factors negatively impact a young adult’s probability of being a conditional cooperator significantly when the individual is matched with a person aged 65 or over. The cooperative behavior of young adults when grouped with an individual of their own age is not shown to be significantly influenced by the factors tested directly, instead I conject that social identity, generated through age identity, motivates cooperative behavior.
I must acknowledge that the limitations of the experiment and empirical analysis, including the hypothetical nature of the survey, exclusive use of binary variables and restricted demographical data, compromises the completeness of the conclusions posed. Notwithstanding, the intention of this study was to provide insights into the impact of age heterogeneity on the mechanics and drivers of cooperative preference of young adults. Future research into this literature should allocate generous focus on considering and understanding the intricate relationships between social preferences, demographical realities, and social identity in heterogeneous age interactions which become increasingly prevalent as society ages.
References
Andreoni, J., & Croson, R. (2008). Partners versus strangers: Random rematching in public
goods experiments. Handbook of Experimental Economics Results, 1, 776-783.
Akerlof, G. A., & Kranton, R. E. (2000). Economics and identity. The Quarterly Journal of
Economics,115(3), 715-753.
Akerlof, G. A., & Kranton, R. E. (2005). Identity and the economics of organizations.
Journal of Economic Perspectives, 19(1), 9-32.
Balliet, D., Li, N. P., Macfarlan, S. J., & Van Vaugt, M. (2011). Sex differences in
cooperation: A meta-analysis review of social dilemmas. Psychological Bulletin,
137(6), 881-909.
Bekkers, R., & Wiepking, P. (2007). Generosity and Philanthropy: A literature review.
Report commissioned by the John Templeton Foundation. Available at:
<https://generosityresearch.nd.edu/assets/17632/generosity_and_philanthropy_final.p
df> (Accessed: 20th November 2020)
Brandts, J., & Charness, G. (2011). The strategy method versus the direct-response method:
A first survey of experimental comparisons. Experimental Economics, 14, 375-398.
Charness, G., & Rabin, M. (2002). Understanding social preferences with simple tests.
Quarterly Journal of Economics, 117(3), 817-869.
Charness, G., & Villeval, M-C. (2009). Cooperation and competition in intergenerational
experiments in the field and the laboratory. American Economic Review, 99(3), 956-
978.
Chaudhuri, A. (2011). Sustaining cooperation in laboratory public good experiments: A
selective survey of the literature. Experimental Economics, 14, 47-83.
Chen, Y., & Li, S. X. (2009). Group identity and social preferences. The American Economic
Review, 99(1), 431-457.
Croson, R. (2002). Why and how to experiment: Methodologies from Experimental
Economics. University of Illinois Law Review, 4, 921-946.
Croson, R. (2007). Theories of commitment, altruism and reciprocity: Evidence from linear
public good games. Economic Inquiry, 45(2), 199-216.
Dawes, R. M. (1980). Social dilemmas. Annual Review of Psychology, 31, 169-93.
Dawes, R. M., Van De Kragt, A. J. C., & Orbell, J. M. (1988). Not me or thee but we: The
importance of group identity in eliciting cooperation in dilemma situation:
Experimental manipulation. Acta Psychologica, 68(1-3), 83-97.
Fehr, E., & Fiscbacher, U. (2002). Why social preferences matter – The impact of non-selfish
motives on competition, cooperation and incentives. The Economic Journal, 112, C1-
C33.
Fehr, E., & Fiscbacher, U. (2003). The nature of human altruism. Nature, 425, 785-791.
Fehr, E., & Schmidt, K. M. (2006). The economics of fairness, reciprocity and altruism –
Experimental evidence and new theories. Handbook of the Economics of Giving,
Altruism, Reciprocity, 1, 615-691.
Fiscbacher, U., & Gächter, S. (2006). Heterogenous social preferences and the dynamics of
free riding in public goods. CeDEx Discussion Paper No.2006-01, University of
Nottingham.
Fiscbacher, U., & Gächter, S. (2010). Social preferences, beliefs, and the dynamics of free
riding in public good experiments. American Economics Review,100(1), 541-556.
Fiscbacher, U., Gächter, S., & Fehr, E. (2001). Are people conditionally cooperative?
Evidence from a public goods experiment. Economics Letters, 71 (3), 397-404.
Fiscbacher, U., Gächter, S., & Quercia, S. (2012). The behavioural validity of the strategy
method in public good experiments. Journal of Economic Psychology, 33, 897-913.
Gutiérrez-Roig, M., Gracia-Lázaro, C., Perelló, J., Moreno, Y., & Sánchez, A. (2014).
Transition from reciprocal cooperation to persistent behaviour in social dilemmas at
the end of adolescence. Nature Communications, 5:4362.
Hobolt, S. B. (2016). The Brexit vote: A divided nation, a divided continent. Journal of
European Public Policy, 23(9), 1259-1277.
Kahneman, D., & Tversky, A. (1979). Prospect theory: An analysis of decision under risk.
Econometrica, 47(2), 263-292.
Keser, C., & van Winden, F. (2000). Conditional cooperation and voluntary contributions to
public goods. Scandinavian Journal of Economics, 102(1), 23-29.
Ledyard, J. O. (1995). Public goods: some experimental results. Social Science Working
Paper No.861, California Institute of Technology. [Published in J.Kagel & A.Roth
(Eds.), The Handbook of Experimental Economics, Princeton: Princeton University
Press (Chap.2)].
List, J. (2004). Young, selfish and male: Field evidence of social preferences. The Economic
Journal, 114 (January), 121-149.
McLeish, K. N., & Oxoby, R. J. (2010). Social interactions and the salience of social identity.
Journal of Economic Psychology, 32, 172-178.
Molina, J. A., Ferrer, A., Giménez-Nadal, J. I., Gracia-Lázaro, C., Moreno, Y., & Sánchez,
A. (2019). Intergenerational cooperation within the household: A public good game
with three generations. Review of Economics of the Household, 15, 535-552.
Office of National Statistics (ONS). (2020). Average household income, UK: financial year
ending 2020 (provisional). Available at:
<https://www.ons.gov.uk/peoplepopulationandcommunity/personalandhouseholdfina
nces/incomeandwealth/bulletins/householddisposableincomeandinequality/financialye
arending2020provisional> (Accessed: 20th January 2021).
Office of National Statistics (ONS). (2021). Overview of the UK population: January 2021.
Available at:<https://www.ons.gov.uk/peoplepopulationandcommunity/populationandmigration/po
pulationestimates/articles/overviewoftheukpopulation/january2021> (Accessed: 15th
April 2021).
Read, D. (2005). Monetary incentives, what are they good for? Journal of Economic
Methodology, 12(2), 265-276.
Samuelson, P. (1954). The pure theory of public expenditures. The Review of Economics and
Statistics, 36(4), 387-389.
Selten, R. (1967). Die Strategiemethode zur Erforschung des eingeschränkt rationale
Verhaltens im Rahmen eines Oligopolexperiments. In H. Sauermann (Ed.), Beiträge
zur experimentellen Wirtschaftsforschung. Tübingen: Mohr, 136-168.
Tajfel, H., & Turner, J. C. (1986). The social identity theory of intergroup behaviour. In in S.
Worchel & W.G. Austin (Ed.), Psychology of Intergroup Relations, Chicago, NelsonHall Publishers, 7-24 .
Yamagishi, T., & Kiyonari, T. (2000). The group as the container of generalized reciprocity.
Social Psychology Quarterly, 63(2), 116-132.
Appendix
Appendix A: Transcript of Survey
This is a transcript of the survey designed using Qualtrics which was distributed online to participants. I present the instruction of the P-C experiment for the Control treatment. Alterations made for the Old and Young treatment are indicated where appropriate.
A.1. Introduction
Welcome to the Dissertation Research Study!
We are interested in understanding the behaviour of young adults aged 18-25 years old. You will be presented with questions relevant to testing behaviour as part of an Economics Dissertation at the University of Nottingham.
The study should take you around 15 minutes to complete. The survey will ask some preliminary demographic questions before conducting an experiment, which will consist of an introduction to the experiment, control questions and the experiment itself.
Please be assured that your response will be anonymous – any demographic information collected will not reveal your identity.
Your participation in this research is voluntary. You have the right to withdraw at any point during the study, for any reason, without prejudice.
If you would like to contact the Principal Investigator of the study to discuss this research, please email Rachel at [email protected].
By participating in the experiment, you will have the chance to enter a lottery to win an £15 Amazon Voucher. To enter the lottery, you will need to enter an email address at the end of the survey.
– All participants who wish to enter the lottery will have an equal chance of being drawn with
the random draw taking place once all responses have been collected.
– Entrance to the lottery is completely voluntary and any email addresses provided will only be
used to contact you if your ID number is drawn from the lottery.
– Once the lottery is completed, your email address will not be stored.
– The outcome of the lottery, if entered, does not depend on any answers given in the survey as
these are kept anonymous.
More details about the lottery will be provided at the end of the survey.
Please note that the study follows the established rules of the Centre for Decision Research and Experimental Economics (CeDEx) at the University of Nottingham and therefore will never employ deception in any of our studies. The study has also gained ethical approval from the School of Economics at the University of Nottingham.
This study will be best displayed on a laptop or desktop computer however it can still be completed on a mobile device. You may wish to use a pen and paper to write down notes and a calculator to help answer the questions.
Please confirm or deny your consent to voluntarily participate in the study, which can be terminated at any time, by selecting an option below.
A.1.1. Age Control
To understand the behaviour of young adults aged 18-25, we shall ask some preliminary demographic questions. All responses will be kept anonymous.
Please confirm your age before continuing.
Q. Which age bracket do you fall into?
a. 10-17
b. 18-25
c. 26-33
d. 34 and over
A.2. Demographic Questions
To understand the behavior of young adults, we shall ask some preliminary demographic questions. All responses will be kept anonymous.
Please answer the following questions as accurately as possible.
A.2.1. Gender
Q. Which gender do you identify most with?
a. Male
b. Female
c. Transgender Male
d. Transgender Female
e. Gender Variant / Non-conforming
f. Not listed, please specify
g. Prefer not to say
A.2.2. Ethnicity
Q. Which of the following best describes you?
a. Arab
b. Asian/Asian British
c. Black/African/Caribbean/Black British
d. Mixed/Multiple Ethnic Groups
e. White/Caucasian
f. A race/ethnicity not listed here, please specify
g. Prefer not to say
A.2.3. Health
Q. How would you rate your physical and mental health?
a. Excellent
b. Good
c. Average
d. Poor
e. Terrible
A.2.4. Education
Q. What is the highest level of education you have completed (or in the process of completing)?
For example, if you are currently in the process of completing an undergraduate degree, select Undergraduate Degree.
a. No schooling
b. GCSEs
c. A Levels
d. Apprenticeship
e. Undergraduate Degree
f. Postgraduate Degree
g. Other, please specify
A.2.5. Religion
Q. What religion do you identify yourself most close to?
a. Asian Folk
b. Hindu
c. Jewish
d. Muslim
e. Christian (Catholic, Protestant or any other Christian denomination)
f. I am not religious
g. A religion not specified above, please specify
h. Prefer not to say
A.2.6. Commitment to Religious Teachings
Q. Do you consider yourself to be committed to your religious teachings?
a. Yes
b. Not sure
c. No
d. Not Applicable
A.2.7. Income
Q. The average family income in the UK is £30,800 (ONS,2020). How would you classify your family
income?
a. Below Average
b. Average
c. Above Average
d. Unknown
A.2.8. Financial Stability
Q. How would you describe your individual financial stability?
a. Extremely comfortable
b. Somewhat comfortable
c. Neither comfortable nor uncomfortable
d. Somewhat uncomfortable
e. Extremely uncomfortable
A.2.9. Parents Age and Relationship Strength
Q1. What is the average age of your living parent(s)? If inapplicable, comment “0”.
Please round the value to the nearest whole number. For example, if your parents average age
is 54.5, round up to 55. If your parents average age is 53.4, round down to 53.
Q2. Which best describes your relationship with your living or deceased parent(s)?
a. Extremely good
b. Somewhat good
c. Neither good nor bad
d. Somewhat bad
e. Extremely bad
f. Not applicable
A.2.10. Grandparents Age and Relationship Strength
Q1. What is the average age of your living grandparent(s)? If inapplicable, comment “0”.
Please round the value to the nearest whole number. For example, if your grandparents average
age is 74.5, round up to 75. If your grandparents average age is 73.4, round down to 73.
Q2. Which best describes your relationship with your living or deceased grandparent(s)?
a. Extremely good
b. Somewhat good
c. Neither good nor bad
d. Somewhat bad
e. Extremely bad
f. Not applicable
A.2.11. Authority
Q. Which best describes your relationship with authority?
Authority is defined as a person or organization having power to give orders, make decisions and
enforce control.
a. Extremely good
b. Somewhat good
c. Neither good nor bad
d. Somewhat bad
e. Extremely bad
f. Prefer not to say
A.2.12. Charitable Giving
Q. Which best describes you and your immediate family’s regular donations to charity?
a. Both my family and I donate to charity
b. I donate to charity, but people in my family do not
c. I do not donate to charity, but people in my family do
d. Neither my family nor I donate to charity
A.2.13. Age Interaction
Q. Which age group do you interact most with?
a. 10 and under
b. 11-17
c. 18-25
d. 26-34
e. 35-44
f. 45-54
g. 55-64
h. 65 and over
A.2.14. Age Competition
Q. Which age group do you compete most with?
Compete is defined as to strive to gain or win something by defeating or establishing superiority
over others. For example, this may mean professionally, socially or for economic gains.
a. 10 and under
b. 11-17
c. 18-25
d. 26-34
e. 35-44
f. 45-54
g. 55-64
h. 65 and over
A.2.15. Demographic Table
In the following table, please select which answer best reflects your opinion of the statement.
Please click the button to continue.
A.2.16. Close of the Demographic Questions
Thank you for completing the preliminary questions. You will now move on to the experiment portion of the survey. All results will be anonymous.
A.3. Instructions for the Experiment
You are now taking part in the experiment. You will need to read the instructions and information carefully to understand how to complete the experiment. You have unlimited time to complete the experiment.
You should not communicate with others whilst completing the experiment as the answers should be personal to you.
It is best to complete all the questions in one sitting. However, if you need to stop, for any reason, you can and it will be possible to return to the questions at a later time.
If you have any questions, please email Rachel at [email protected].
You may find it helpful to have a pen, paper and calculator to hand as you will be required to calculate a simple formula which determines your hypothetical income from the experiment.
The decision situation that you will need for the experiment is detailed below.
A.3.1. The Decision Situation
We first introduce you to the basic decision situation that will be used in the experiment. You will find control questions at the end of this section to help you understand the situation.
Set Up
You will be a member of a 2-person group consisting of yourself and one other person. The other member will be a random hypothetical individual. The hypothetical individual is not an actual person. However, you should think of them as another person who you are in a group with.
Each group member has to decide on the allocation of 10 tokens. You can put these 10 tokens into your private account, or you can invest them fully or partially into an arbitrary group project. Each token you do not invest into the project, will automatically remain in your private account.
The tokens should be thought as equivalent to monetary units. However, your token income is hypothetical and will not be paid out to you in monetary terms at the end of the experiment.
Your Income from the Private Account
You will earn one token for each token you put into your private account. That is, every token you do not invest into the group project, you keep.
Your Private Account Income = 10 – Your Contribution to the Project
For example:
– If you put 10 tokens into your private account (and therefore do not invest into the project) your private account income will amount to 10 tokens.
– If you put 6 tokens into your private account, your income from this account will be 6 tokens and you will have contributed 4 tokens to the project. No one except you earns tokens from your private account.
Your Income from the Project
Both group members, you and the hypothetical individual, will profit equally from the amount invested into the project.
Your income from the project, which is equivalent for the hypothetical individual, will be determined as follows:
Your Income from the Project = Sum of all Contributions to the Project x 0.6
You can contribute any amount you wish to the project. For example:
– If you contribute 10 tokens and the other member contributes 10 tokens, then you earn 20 x 0.6 = 12 tokens from the project.
– If you contribute 5 tokens and the other member contributes 10 tokens, then you earn 15 x 0.6=9 tokens from the project.
Your Total Income
Your total income is the sum of your income from your private account and income from the project:
Your Total Income = Income from your Private Account + Income from the Project
Your Total Income = (10 – Your Contribution to the Project) + (0.6 x Sum of all Contributions to
the Project)
You may want to write down these formulas to refer to later in the experiment, however, they will be repeated throughout the study. You may use a calculator to work out these formulas if needed.
Please ensure you have read these instructions carefully so that you understand the experiment. Please click the arrow to progress to the control questions which will help you understand the calculation of your income.
A.3.2. Control Questions
Please answer all of the following control questions to help you understand the calculation of your income using the formulas just given to you.
Your income varies depending on your contribution and the contributions of the other hypothetical individual in your 2-person group. Note that there is no time limit to this survey – take as long as you need to calculate your hypothetical income.
You must get all of the control questions right before proceeding with the experiment. Any incorrect answers will be highlighted.
1. Both group members have 10 tokens. Assume that neither member (including you) contributes any tokens to the project.
a. What will your total income be?
b. What will the total income of the other group member be?
2. Both group members have 10 tokens. You and the other member both invest 10 tokens in the project.
a. What will your total income be?
b. What will the total income of the other group member be?
3. Both group members have 10 tokens. The other member contributes a total of 5 tokens to the project. Round all values to the nearest integer. For example, 10.4 rounds to 10 and 8.5 rounds to 9.
a. What will your total income be if you, in addition to the 5 tokens of the other member, invest 0 tokens into the project?
b. What will your total income be if you, in addition to the 5 tokens of the other member, invest 8 tokens into the project?
4. Both group members have 10 tokens. Assume that you invest 8 tokens to the project. Round all values to the nearest integer. For example, 10.4 rounds to 10 and 8.5 rounds to 9.
a. What is your total income if the other group member, in addition to your 8 tokens, contributes another 7 tokens to the project?
b. What is your total income if the other group member, in addition to your 8 tokens, contributes another 10 tokens to the project?
Thank you for completing the introduction. Please click the arrow below to progress to the next stage.
A.4. The Experiment
A.4.1. Instructions for the Experiment
You will now take part in the experiment. The experiment includes the decision situation described to you in the introduction.
As a reminder: You will have 10 tokens at your disposal. You can put them into a private account or you can invest them into a project.
Your Total Income = Income from your Private Account + Income from the Project
Your Total Income = (10 – Your Contribution to the Project) + (0.6 x Sum of all Contributions to
the Project)
In the experiment, you should answer the questions truthfully. The experiment will only be conducted
once.
You will have to make two types of decisions in this experiment, which are referred to as the “Unconditional Contribution” and “Contribution Table”.
In the old (young) treatment, the following passage is also shown:
You are also given the following information: The other hypothetical individual in your group is aged 65 or over (18 – 25).
A.4.2. P-Experiment
A.4.2.1 Unconditional Contribution
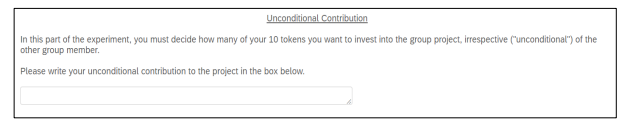
Once you have filled in the box, please click the button to continue.
A.4.2.2 Contribution Table
You will now fill in the following “Contribution Table”, where you need to indicate how many tokens you want to contribute to the project for each possible contribution of the other group member.
You can condition your contribution on that of the other group member. This will be immediately clear to you by looking at the table below.
The numbers are the possible (rounded) contributions to the project by the other group member. You simply have to select, using the slider, how many tokens you want to contribute to the project.
You must make an entry for each contribution amount of the other member. For example, you will have to indicate how much you contribute to the project if the other member contributes 0 tokens to the project, or 1 token to the project, etc. up to 10 tokens.
The following information was altered depending on the treatment to remind subjects of the age of the other participant. The parentheses indicate the changes for the old/young treatment.
The other (65 or over/18 to 25 year olds) individual’s contribution is given from 0 to 10 tokens. Use the slider to indicate the number of tokens you contribute from your pot of tokens in each situation.
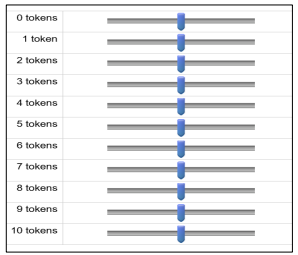
If you decide you want to contribute 0 tokens, ensure that the slider button is dark blue to record your response.
A.5. C Experiment
A.5.1. Instructions for the Experiment
We will now conduct another experiment. The whole study will finish after this experiment is completed.
In this experiment, you have to make your contribution decision to the project against a randomly assigned hypothetical individual and indicate your beliefs of their contribution to the project.
You will have to make two inputs:
– First, you have to decide on your contribution to the project, that is, you have to decide how many of the 10 tokens you want to contribute to the project, and how many tokens you want to put into your private account. This decision is the same as the unconditional contribution in the previous experiment.
– Second, you have to estimate the contribution to the project by the other hypothetical group member (rounded to an integer).
The following insert was including in the old (young) treatment:
[You are again given the following information about the other member: The other hypothetical individual in your group is aged 65 or over (18-25 years).]
The decision situation in this experiment is the same as that described at the beginning of the previous experiment:
– Each member of the group has to decide about the usage of the 10 tokens.
– You can put these 10 tokens into your private account or you can invest them fully or partially into a project.
Your Total Income = Income from your Private Account + Income from the Project
Your Total Income = (10 – Your Contribution to the Project) + (0.6 x Sum of all Contributions to
the Project)
Remember your income in this experiment is hypothetical, you will not be paid the amount of tokens you accumulate.
A.5.2. Control Question for Old and Young Treatment
An additional control question was including in the old and young treatment to ensure that subjects knew the age of the other hypothetical individual.
You will now be asked a control question to check your understanding before proceeding to the experiment.
To check your understanding of the experiment, please answer the following question.
Q. What is the age of the other hypothetical player in the experiment?
a. 10-17
b. 18-25
c. 26-39
d. 40-64
e. 65 or over
